 eAtlas Data Catalogue
School of Environment, Griffith University (GU)
Type of resources
Topics
Contact for the resource
Provided by
Years
Formats
Representation types
Update frequencies
status
Scale
-
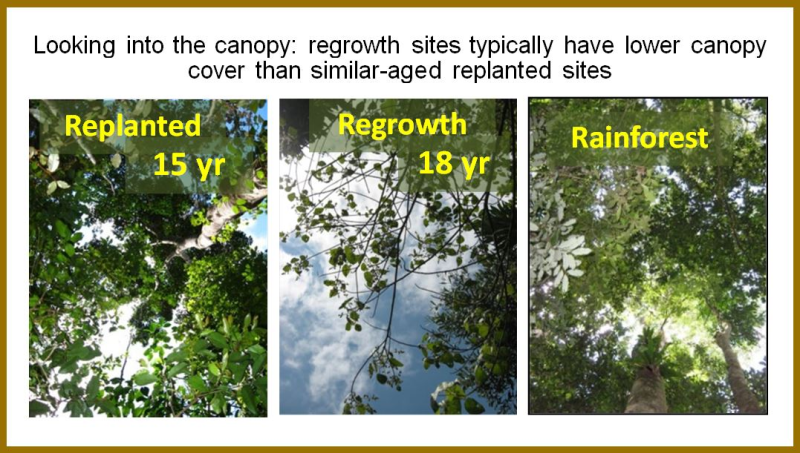
This data set describes change in forest attributes over time in response to passive regrowth and biodiverse ecological restoration plantings across the southern Atherton uplands. These data were obtained from four sets of spatially replicated site-types: (1) a chronosequence of 29 passive regrowth sites (1-67 years) on previously forested land with a subsequent period of land use for agriculture (e.g. cropping or grazing); (2) a comparable chronosequence of 25 actively planted sites (1-25 years); (3) five pasture reference sites, indicating the pre-reforestation condition; and (4) eight rainforest reference sites indicating the target of reforestation. The reference sites provide a context for interpreting the developmental trajectories of reforested sites. Development trajectories are measured using a range of structural and floristic attributes. The primary purpose for collecting this data was to: (1) evaluate time lags and uncertainty of recovery for different elements of tropical forest (i.e. structure, biomass, species density and community composition) through passive regrowth and active planting; (2) identify forest attributes that are particularly slow to develop under either approach; (3) explore ecological explanations for the later that might suggest barriers to recovery and inform modifications to current restoration practices to catalyse outcomes. The study was conducted in wet tropics uplands of the south-central Atherton Tableland, north eastern Australia (17°10´ – 17°35´S, 145°30´ – 145°45´E). Field surveys in ecological restoration plantings and reference sites (pasture and forest) were completed between May 2008 and August 2009. Comparative assessments of regrowth sites were conducted between October 2012 and June 2013. Methods: Vegetation structure and floristic composition at each site were measured within two 50 x 20 m transects (combined for analysis as one 100 m transect), using an established monitoring protocol (Kanowski et al. 2010). Four types of structural attribute were quantified: canopy cover, canopy height, wood volume and woody stem density. Canopy cover (%) and height (m) were averaged across six 10 x 10 m quadrats, centred 5, 25, 45, 55, 75 and 95 m along the transect. Stems of all trees and shrubs (free-standing woody-stemmed plants, henceforth ‘TS’) >1.0 m tall were counted in variable-width transects, according to the following dbh categories (cm): <2.5, 2.5-5, 5-10, 10-20, 20-30, 30-40, 40-50, 50-75, 75-100, >100. Transect widths were 5, 10 and 20 m respectively for stem dbh categories <10, 10-50, and >50 cm, giving respective areas surveyed of 500, 1,000, and 2,000 m2. Presence of special life forms (i.e. vines, epiphytes and ferns), canopy cover and canopy height were assessed within three 10 x 10 m quadrats centred on the 5, 25 and 45 m points of each transect. Aboveground biomass of live trees and shrubs was calculated from site-specific stem data together with assumed average wood densities from Kanowski et al. (2010b). Data on forest attributes were pooled for each site. Estimates of stem density and species density of freestanding trees and shrubs were further partitioned according to species origin, dispersal mode and diaspore size (seeds plus any additional tissues that assist in dispersal) and membership to near-basal plant families. Origin was simply native or non-native. We considered separately species dependent on either of two important dispersal vectors. These were ‘wind dispersed’ and ‘bird or bat dispersed’. The later did not include non-volant (non-flying) vertebrates and invertebrates such as cassowary, musky-rat kangaroo, rodents, pigs and ants. For animal dispersed plant taxa, we further differentiated between those species with small diaspores (< 10 mm) and moderate to large diaspores (> 10 mm) to reflect important variation in frugivore capacity (Moran & Catterall 2010). Near-basal plant families followed the assessment of Metcalfe and Ford (2009) derived from current molecular phylogeny of angiosperms. This focus on plant families with ancient origins is in recognition of their importance to the “outstanding universal value” of the Wet Tropics World Heritage Area and is relevant to ongoing management targeted at conserving evolutionary history. Further details can be found in this publication: SHOO, L. P., FREEBODY, K., KANOWSKI, J., & CATTERALL, C. P. (2015). Slow recovery of tropical old field rainforest regrowth and the value and limitations of active restoration. Conservation Biology. DOI: 10.1111/cobi.12606 References: Kanowski, J., C. P. Catterall, K. Freebody, A. N. D. Freeman, and D. A. Harrison 2010a. Monitoring Revegetation Projects in Rainforest Landscapes. Toolkit Version 3. Reef and Rainforest Research Centre Ltd., Cairns. http://www.rrrc.org.au/publications/biodiversity_monitoring3.html. Kanowski, J. and Catterall, C.P. 2010b. Carbon stocks in above-ground biomass of monoculture and mixed species plantations and environmental restoration plantings in north-east Australia. Ecological Management and Restoration 11: 119-126. Metcalfe, D. J., and A. J. Ford. 2009. A re-evaluation of Queensland's Wet Tropics based on 'primitive' plants. Pacific Conservation Biology 15:80-86. Moran, C., and C. P. Catterall. 2010. Can functional traits predict ecological interactions? A case study using rain forest frugivores and plants in Australia. Biotropica 42:318-326. Limitations: Biomass calculations were based on certain assumptions, and should therefore be interpreted as broad estimates rather than accurate values. However, they do represent more accurate estimates of relative above ground wood volume. Format: An XLSX file (21 MB), Catterall Shoo et al Data extract on developmental trajectories of forest recovery.xls, containing containing two (2) spreadsheets; data and metadata. The metadata sheet contains units and descriptions for the columns in the data spreadsheet. Data Dictionary: - Site_code: Unique site identification code - Site_type: Type of site (forest, pasture, regrowth, planting) - Age_at_survey years: Estimated age of regrowth or planting at time of survey - Canopy.cover (%): Visual estimate of projective cover of vegetation above 2m from ground - Canopy.height.m (meters): Height of the tallest tree in the canopy within each quadrat - Wood.volume.m3perha.allTrees (m3 per ha): Estimate of volume of wood - stems.perha.dbh.2.5cm.plus (stems per ha): Count of stems of freestanding trees or shrubs > 2.5 cm diameter, calibrated by area of variable width transects utilised for different diameter classes - all taxa - stems.perha.dbh.2.5cm.plus.native (stems per ha): Count of stems of freestanding trees or shrubs > 2.5 cm diameter, calibrated by area of variable width transects utilised for different diameter classes - native taxa only - stems.perha.dbh.2.5cm.plus.exotic (stems per ha): Count of stems of freestanding trees or shrubs > 2.5 cm diameter, calibrated by area of variable width transects utilised for different diameter classes - non-native taxa only - spp.rich.all (species per site): Count of the number of species of freestanding trees or shrubs (> 1 m tall) - all taxa - spp.rich.all.native (species per site): Count of the number of species of freestanding trees or shrubs (> 1 m tall) - native taxa only - spp.rich.all.exotic (species per site): Count of the number of species of freestanding trees or shrubs (> 1 m tall) - non-native taxa only - spp.rich.all.basal.native (species per site): Count of the number of species of freestanding trees or shrubs (> 1 m tall) - native taxa from near-basal plant families only - spp.rich.all.native.wind.dispersed (species per site): Count of the number of species of freestanding trees or shrubs (> 1 m tall) - wind dispersed native taxa only - spp.rich.all.native.bird.bat.dispersed.diaspore.1 (species per site): Count of the number of species of freestanding trees or shrubs (> 1 m tall) - animal dispersed native taxa, with small diaspores (< 10 mm) - spp.rich.all.native.bird.bat.dispersed.diaspore.2.3 (species per site): Count of the number of species of freestanding trees or shrubs (> 1 m tall) - animal dispersed native taxa, with moderate to large diaspores (> 10 mm) - spp.rich.vines.native (species per site): Count of the number of species of native vines - spp.rich.ferns.native (species per site): Count of the number of species of native ferns - spp.rich.epiphytes.native (species per site): Count of the number of species of native epiphytes - mean.sim (Sørensen similarity index): Average native tree and shrub species similarity to the forest reference sites
-
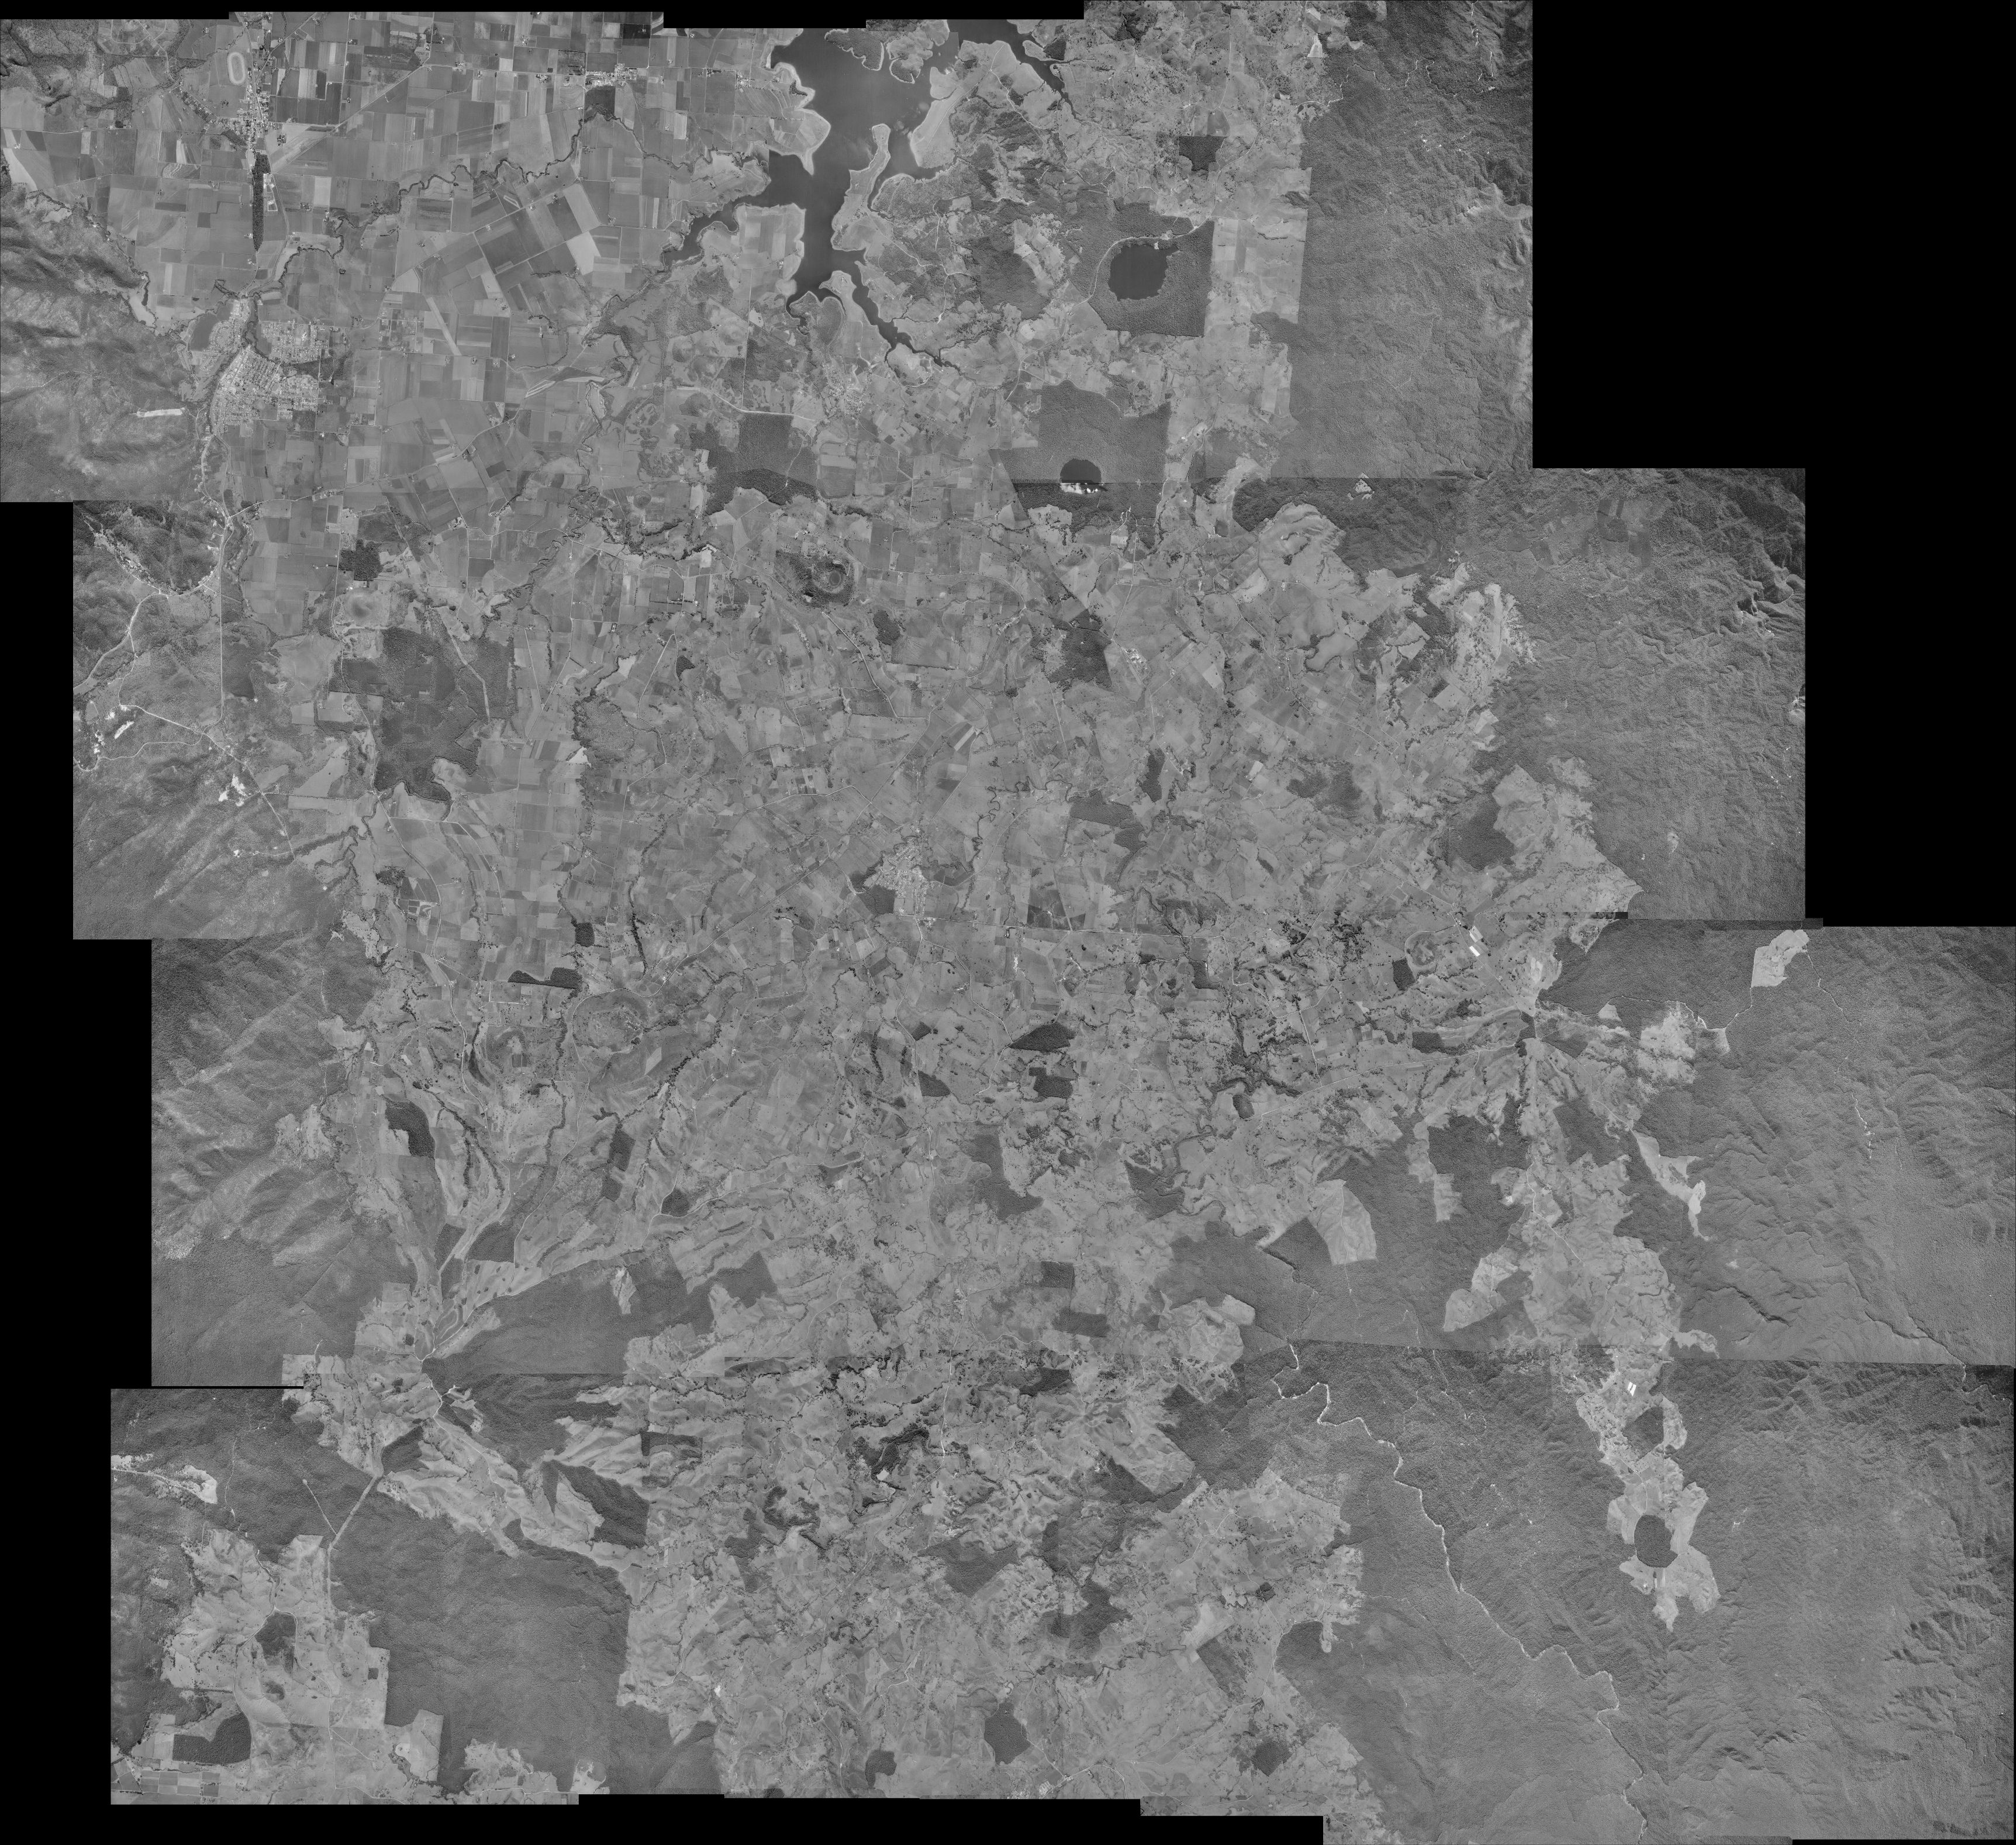
This dataset is a photo mosaic of historic aerial imagery of the southern Atherton Tablelands from 16th June 1978. It includes the towns of Atherton, Malanda, Yungaburra and Tolga. It has a southern boundary just north of Millaa Millaa, a northern boundary of Lake Tinaroo, an eastern boundary of a quarter of Wooroonooran National Park and a western boundary of Atherton. This photo mosaic was compiled to assist in the location of rainforest regrowth areas for the NERP-TE project 12.2, Harnessing natural regeneration for cost-effective rainforest restoration (Griffith University, University of Queensland). This photo mosaic was produced by Atherton Tablelands Geographical Information Services (ATGIS), April 2012, from digital data provided by Department of Environment and Resource Management (DERM), Queensland. Aerial photography ownership; Department of Environment and Resource Management (Queensland). Aerial photography data is "© State of Queensland (Department of Environment and Resource Management) [2012]". The photo mosaic is 13792x12623 pixels with a pixel size of 2.75mx2.75m and has a spatial reference of MGA55 (EPSG:28355). The original mosaic is stored in ECW format (18 MB). A GeoTiff version of the mosaic was created for the eAtlas (440 MB).
-
The project will assist decision-makers to more efficiently restore biodiversity to degraded rainforest landscapes by providing new knowledge about the outcomes of lower-cost natural regeneration (including potential for minimum intervention management) relative to higher-cost active reforestation (replanting) on post-agricultural land. The outcomes of this project will enable planners to assess the costs, risks and benefits of different approaches to reforestation and choose the most appropriate method for any particular ecological and economic context. This project will: 1. Quantify the rate and pattern of development of vegetation during rainforest regrowth following cessation of agricultural use, and how this compares with the outcomes of publicly-funded restoration by tree-planting. 2. Investigate, trial and promote emerging technologies for the acceleration and redirection of rainforest regrowth, to overcome ecological barriers or thresholds that inhibit rainforest redevelopment. 3. Identify locations and situations where passive restoration (unassisted regrowth) is a preferable alternative to high-cost active restoration (replanting). This will help government agencies and landholders to better forecast outcomes resulting from passive regeneration over defined time frames. This knowledge will also be useful to private enterprises interested in capitalising on emerging carbon markets. This work will be done on the Atherton Tablelands in the Wet Tropics.
-
This project involved working with a range of stakeholders to identify the most effective governance systems for managing climate change adaptation in the Wet Tropics through the emergence of new ecosystem service markets, including Carbon Farming. The project will directly contribute to: Regional climate change adaptation policies and planning processes, Regional Natural Resource Management (NRM) organisations’ role in guiding emerging carbon markets in Australia and the region. This project developed: 1. Detailed Practical Manuals for NRM Bodies concerning planning and carbon market integration in place and training delivered across Queensland regional NRM bodies. 2. Defined partnership arrangements for refinement of Governance systems, institutional and planning reforms maintained. 3. Theory based publication on governance systems required for application of ecosystem service market activities against NRM plan objectives.